

I’m Bi-Snowler, meaning I ski and snowboard. So, I want to figure out how much better I am at one vs the other. That metric will be based on average speed.
I went to the Beaver Run lift at Breckenridge resort at Peak 9. That lift has the highest vertical rise at Breckenridge at 1,585’. I rode the same line 3 times in each discipline at a comfortable speed, meaning as fast as I could without scaring myself. I used Avenza on my iPhone 13 Pro. Before my field work, I made a map in Arc PRO to insert into Avenza to use while capturing. I captured all the tracks individually in a single layer, in Avenza.
Since I was figuring out speed relative to distance my data dictionary would be simple, all I need is “moving time” and “distance” to calculate my averages across the three runs. I can also figure out my quickest time and my top speed out of the 3 runs per discipline. Luckily, Avenza calculates some of these metrics automatically. The other calculations were easy and only required a calculator. My data dictionary consist of these metrics:
Average Time
Quickest Time (Avenza calculation)
Average Speed
Average Top Speed
Top Speed (Avenza calculation)
Average Distance
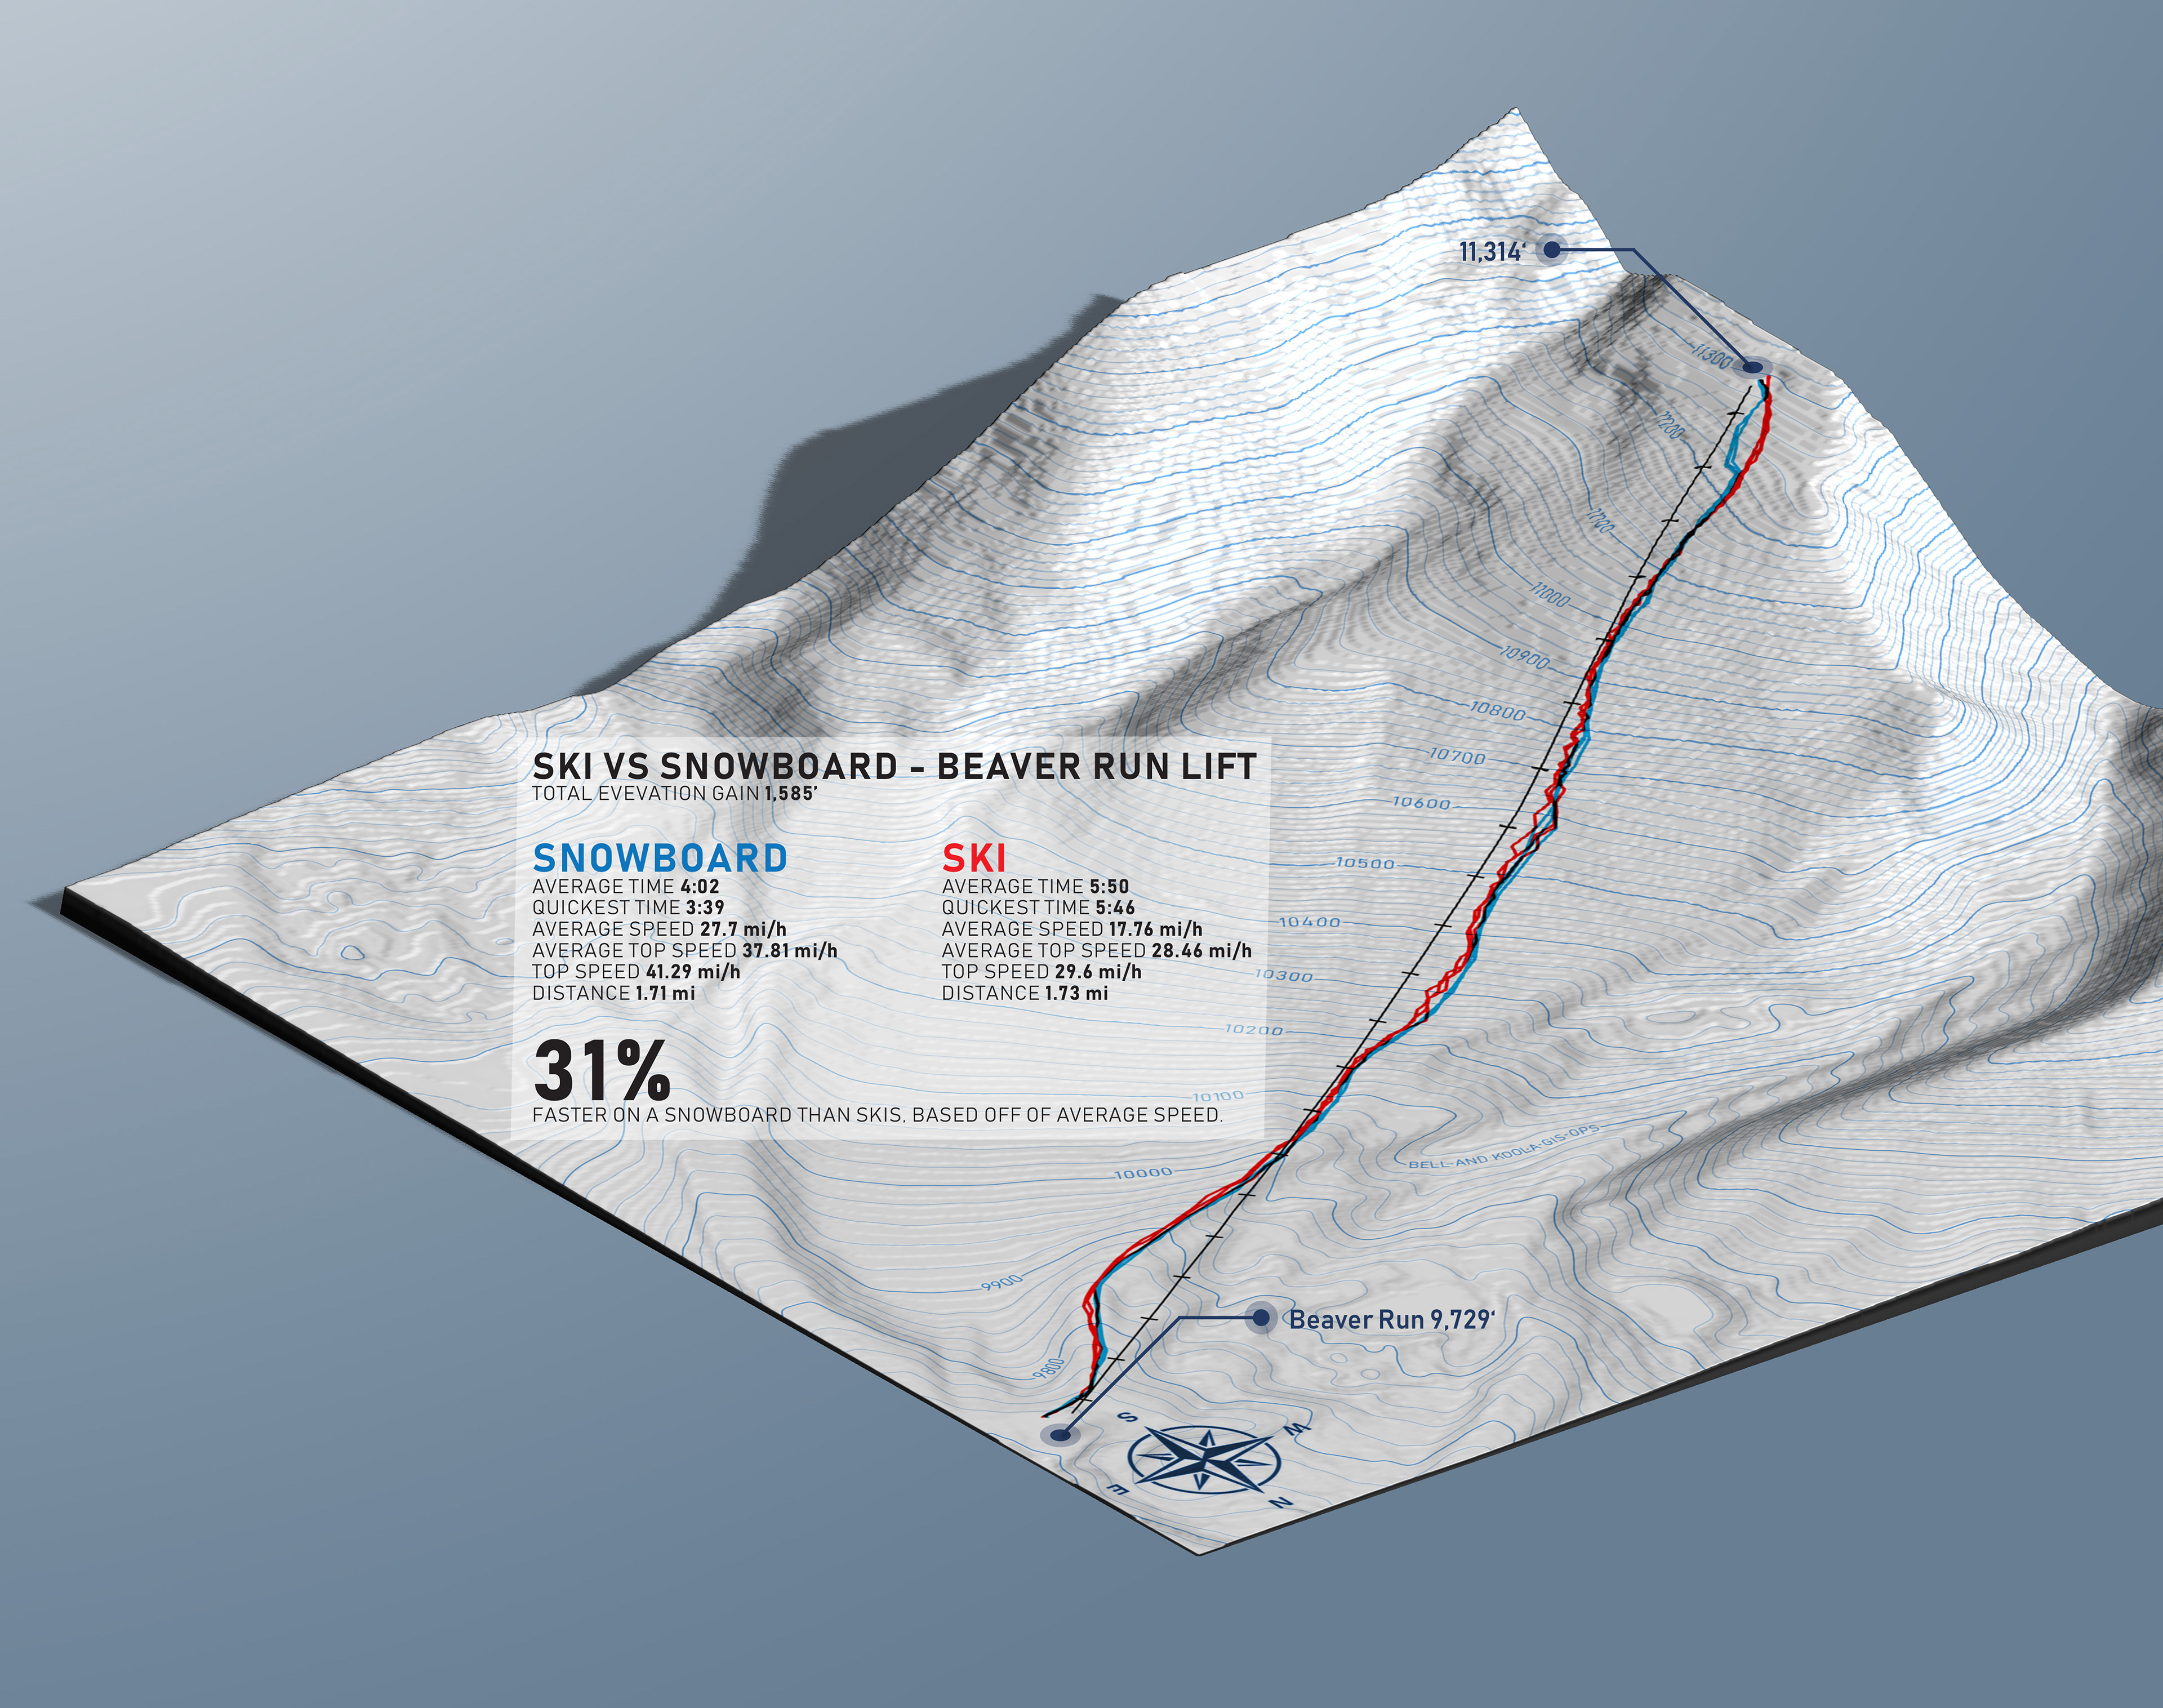
I took the same ArcPro map I made for Avenza and used the GPX to Features tool to import in my tracks. Then I edited the base map out and added a slope hillshade and a light Contour with annotated labeling. My end game was to use a Photoshop plug-in called 3D Map Generator - Atlas. For me to use it though, I had to output a very specific pixel size document; 4200px x 4200px. Back In ArcPRO I reset my layout to that size as well as rotating the layout 90 degrees. I exported out the DEM and the new base map at that specific size.
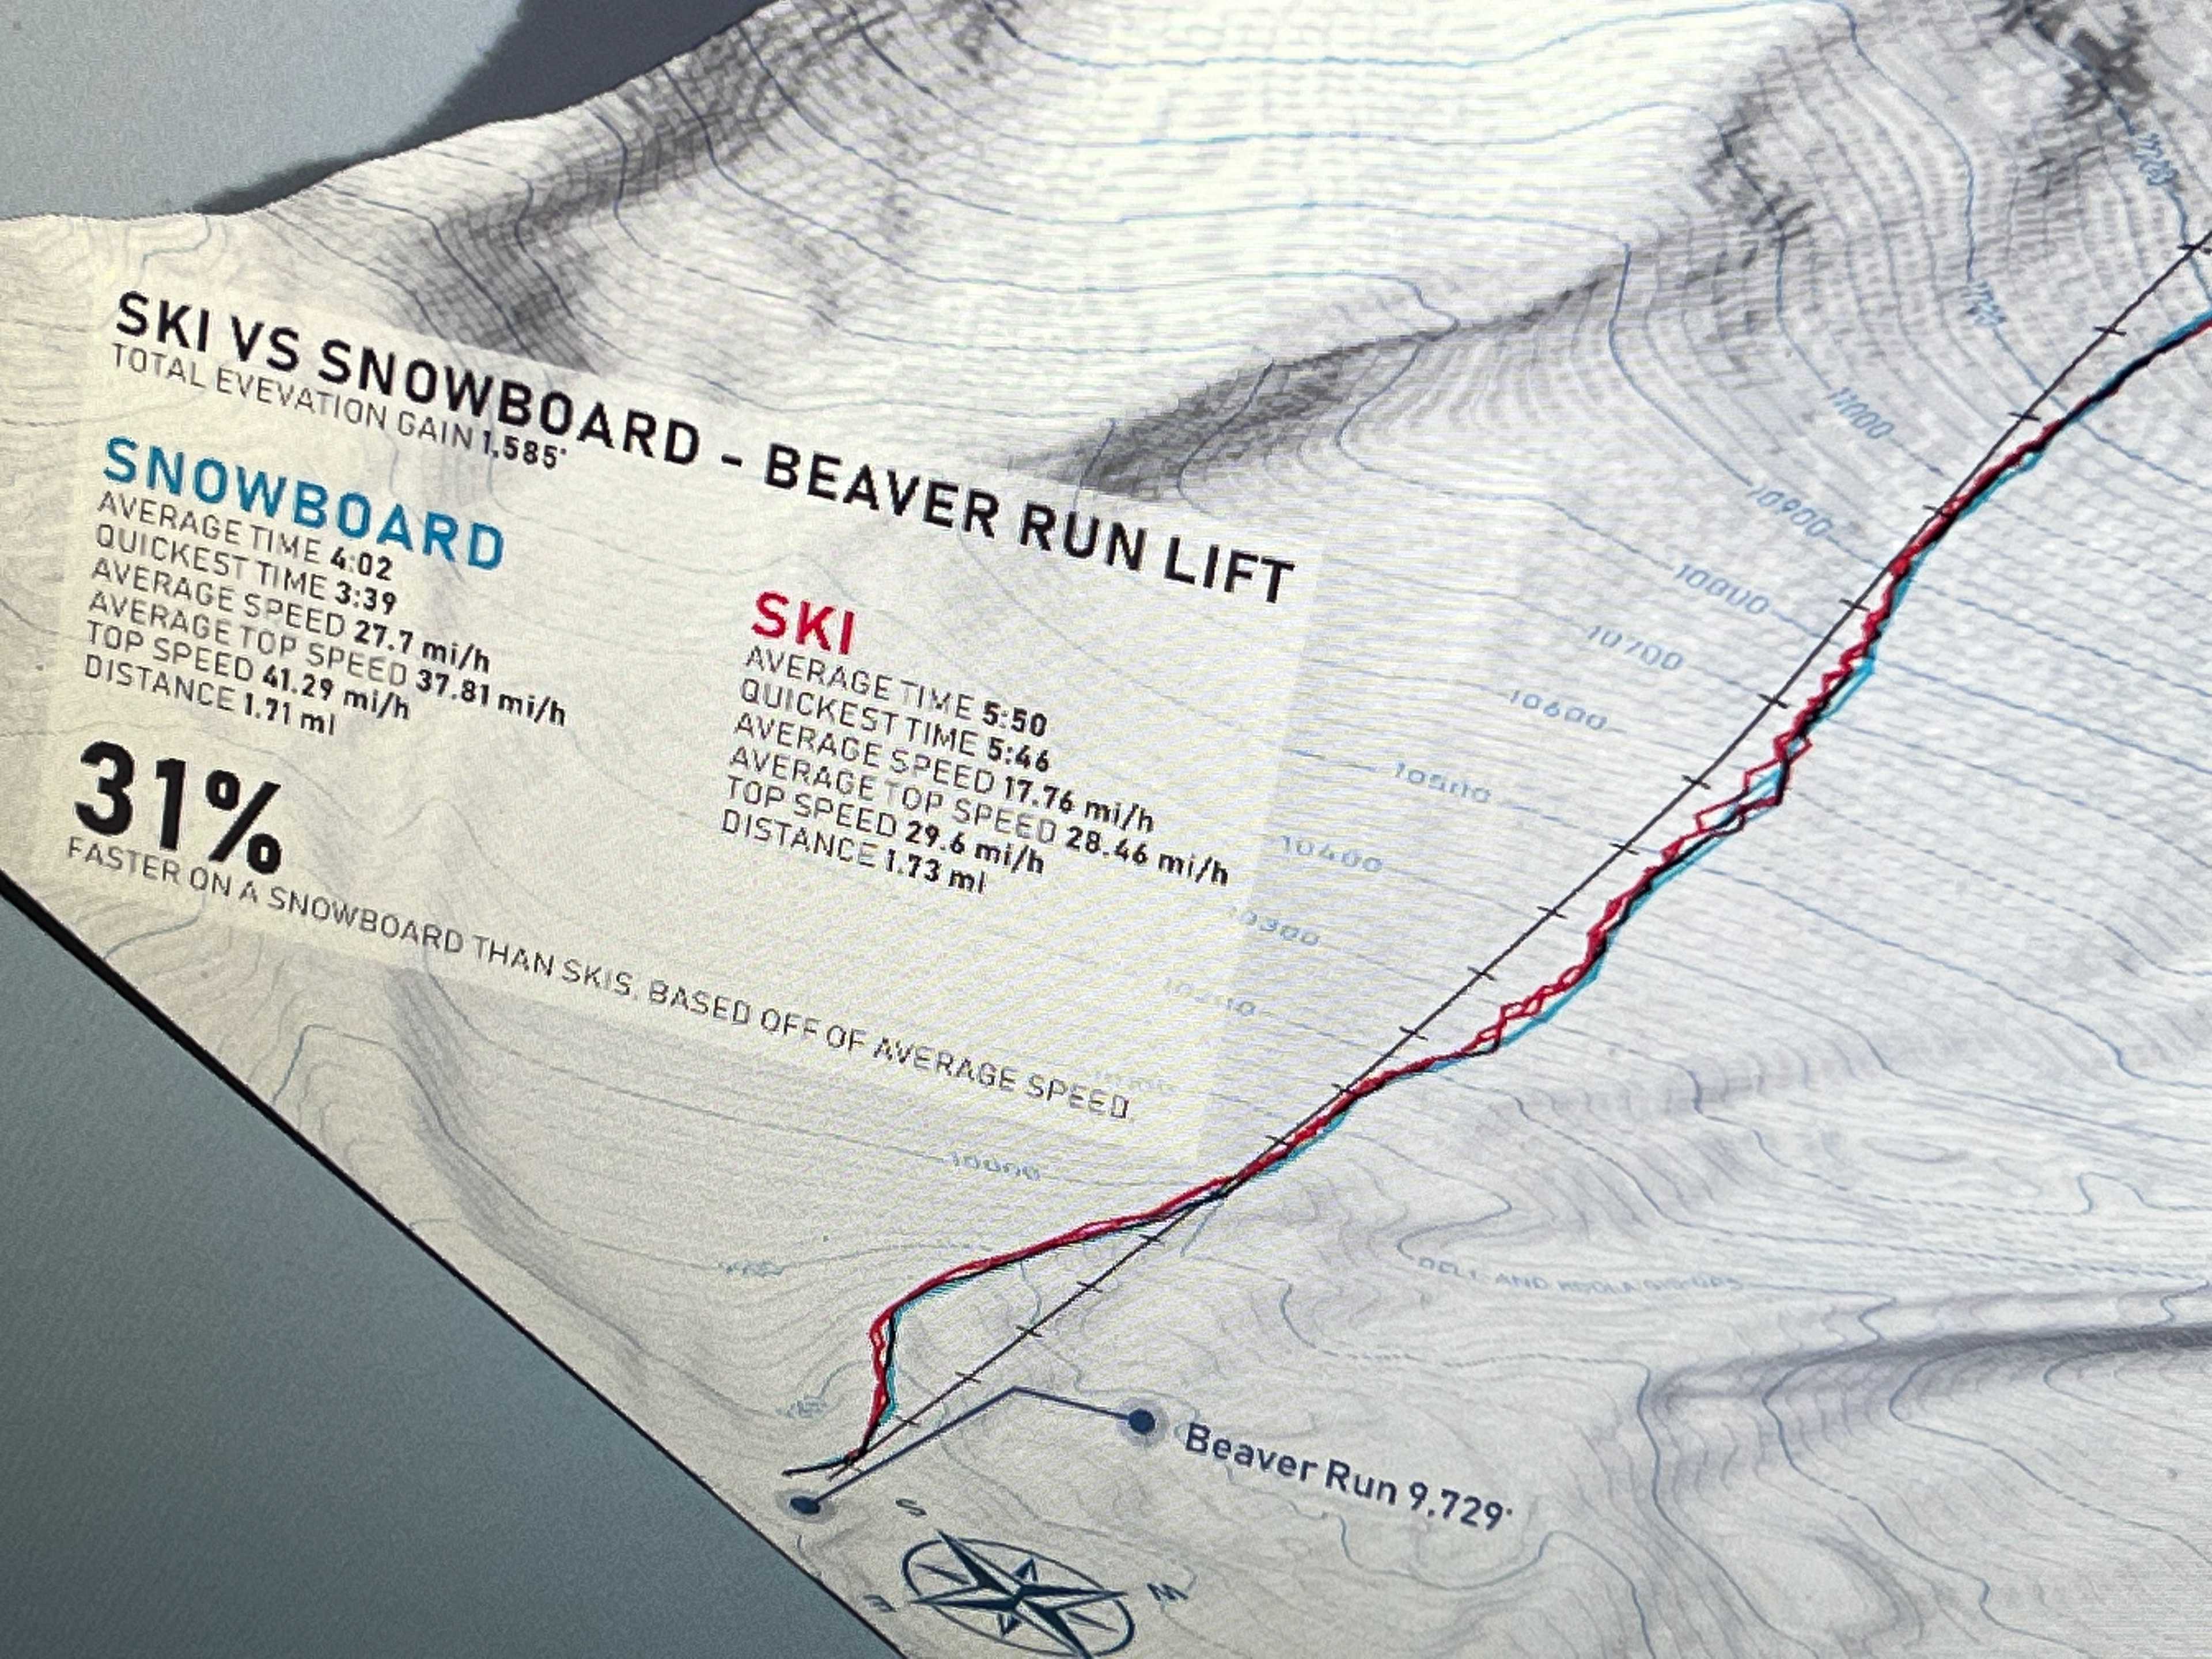
The rest of the work was done in Photoshop with Atlas. Atlas is a 3D isometric plug-in, and once it was done creating the 3D object I could add the two labels at either end of the lift.
I lastly added the compass rose from the Adobe Stock Library and the stats typography, which was laid-out in Illustrator.
I lastly added the compass rose from the Adobe Stock Library and the stats typography, which was laid-out in Illustrator.
Oh, and I’m 31% faster (better?) on a snowboard than I am on skis.
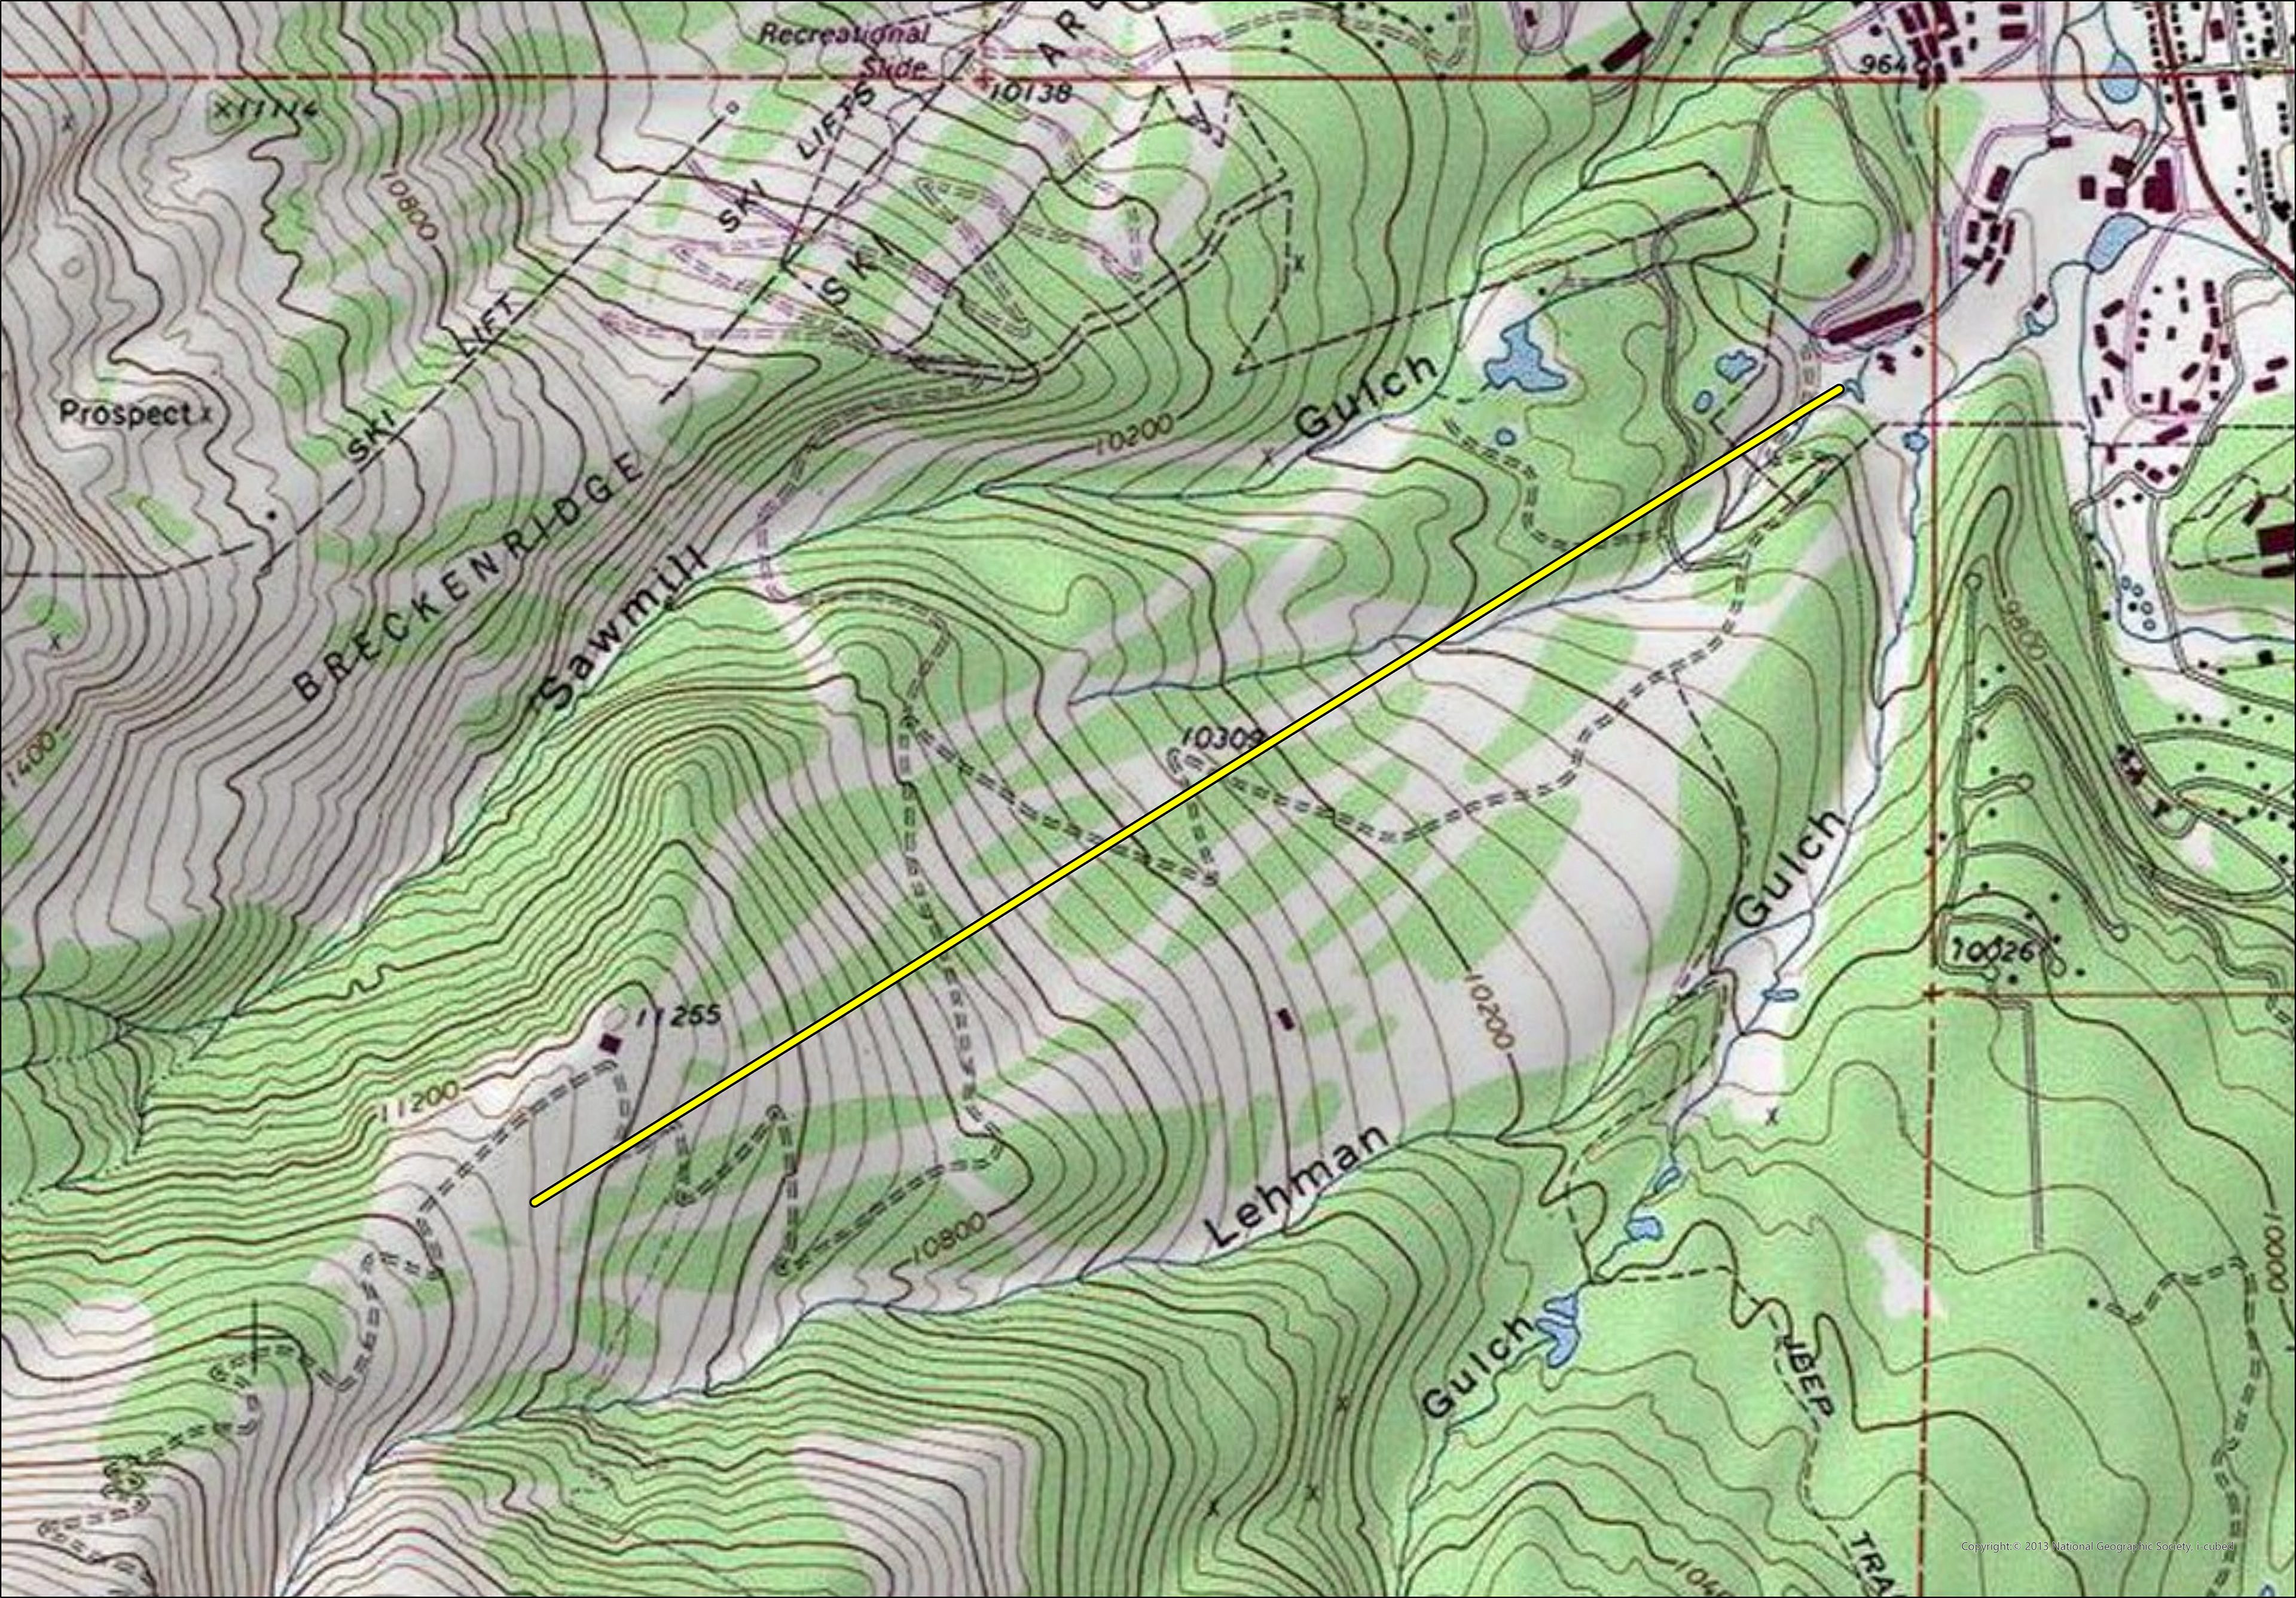
This is the Caltopo map i made to capture the data in Avenza.