

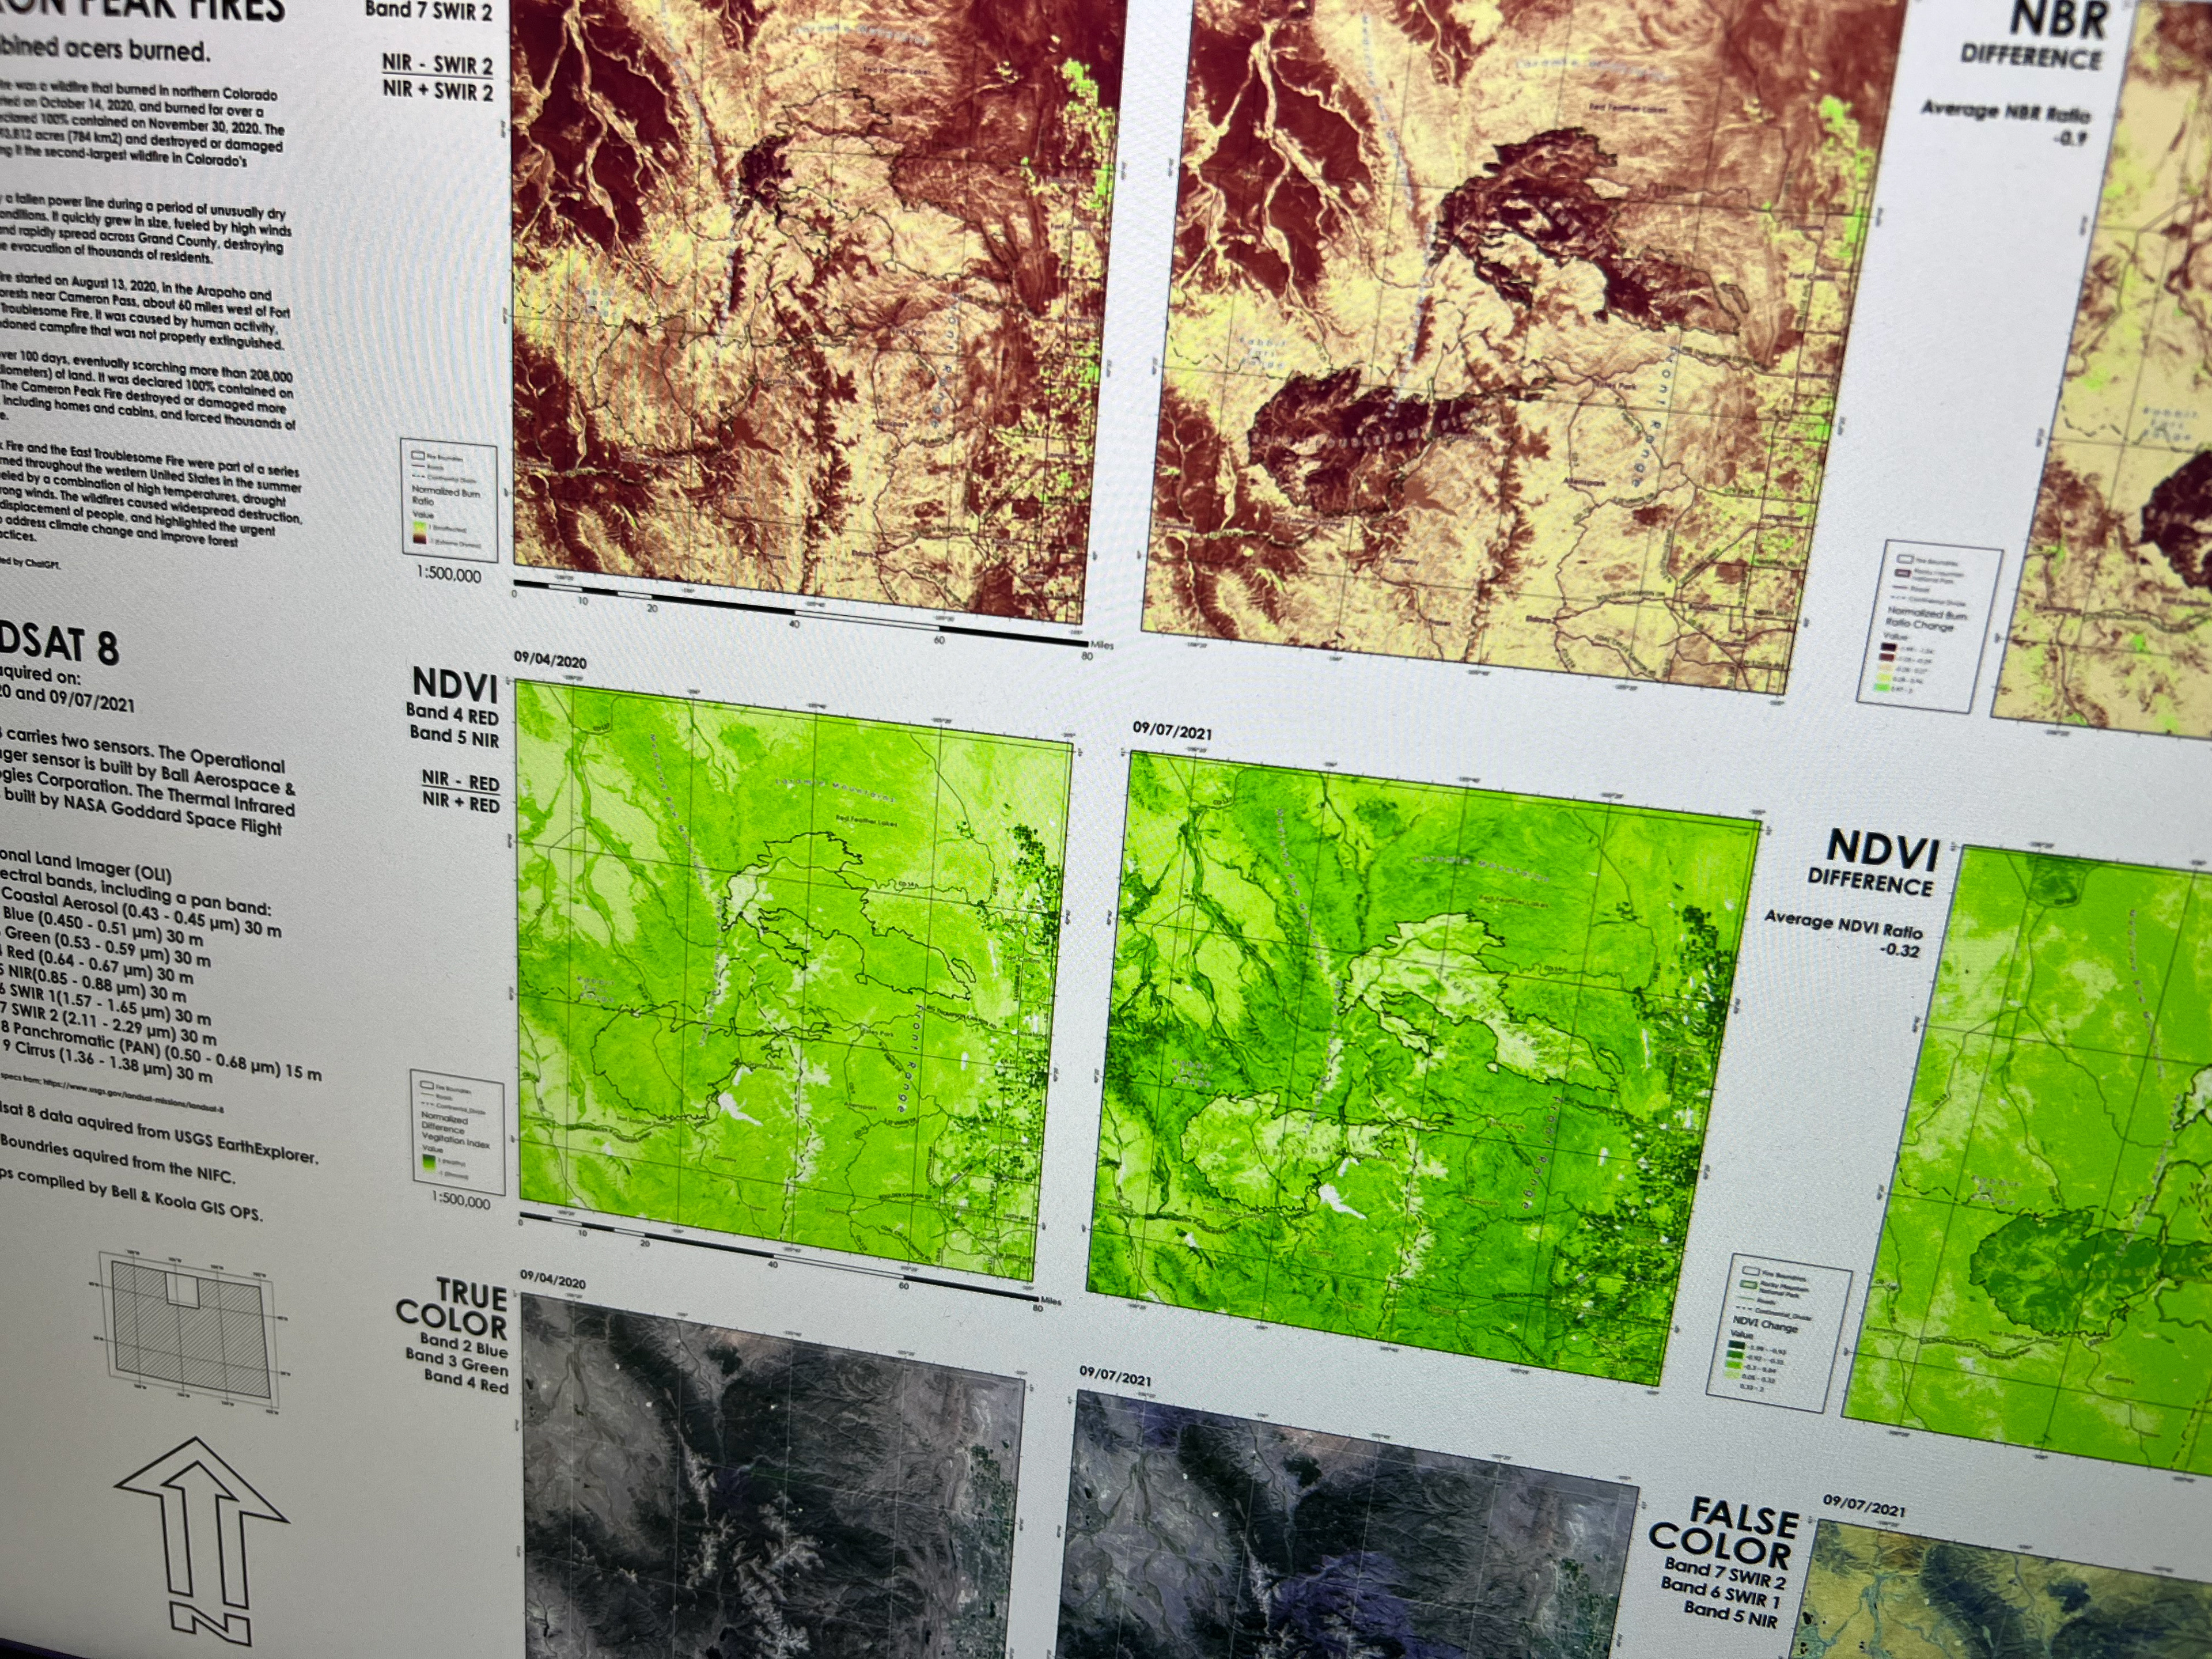
In the late summer of 2020, I could see the smoke from the East Troublesome Fire, even though I was about 50 miles away, and that is the subject of this multimap piece.
On the USGS EarthExplorer website, I found proper dates, about two weeks before the start of the East Troublesome fire that was clear of cloud cover. The second date, just over a year later, was also clear of clouds. These dates were also in the late summer, so snow cover would be at its minimum.
I downloaded the ‘tarballs’ and examined the rater data and I found that the extent of the rasters also included the Cameron Peak fire, which started almost two weeks earlier. I decided to include the Cameron Peak fire in my analysis.
To calculate the average NBR and NDVI ratios I needed the fire boundaries, which I found on the NIFC website.I got the RMNP boundary from the forest service and the rest of the data, Colorado roads and towns, came from my personal data archive. The natural feature, mountain ranges, I geo referenced from an ESRI base map, and created a new feature layer.
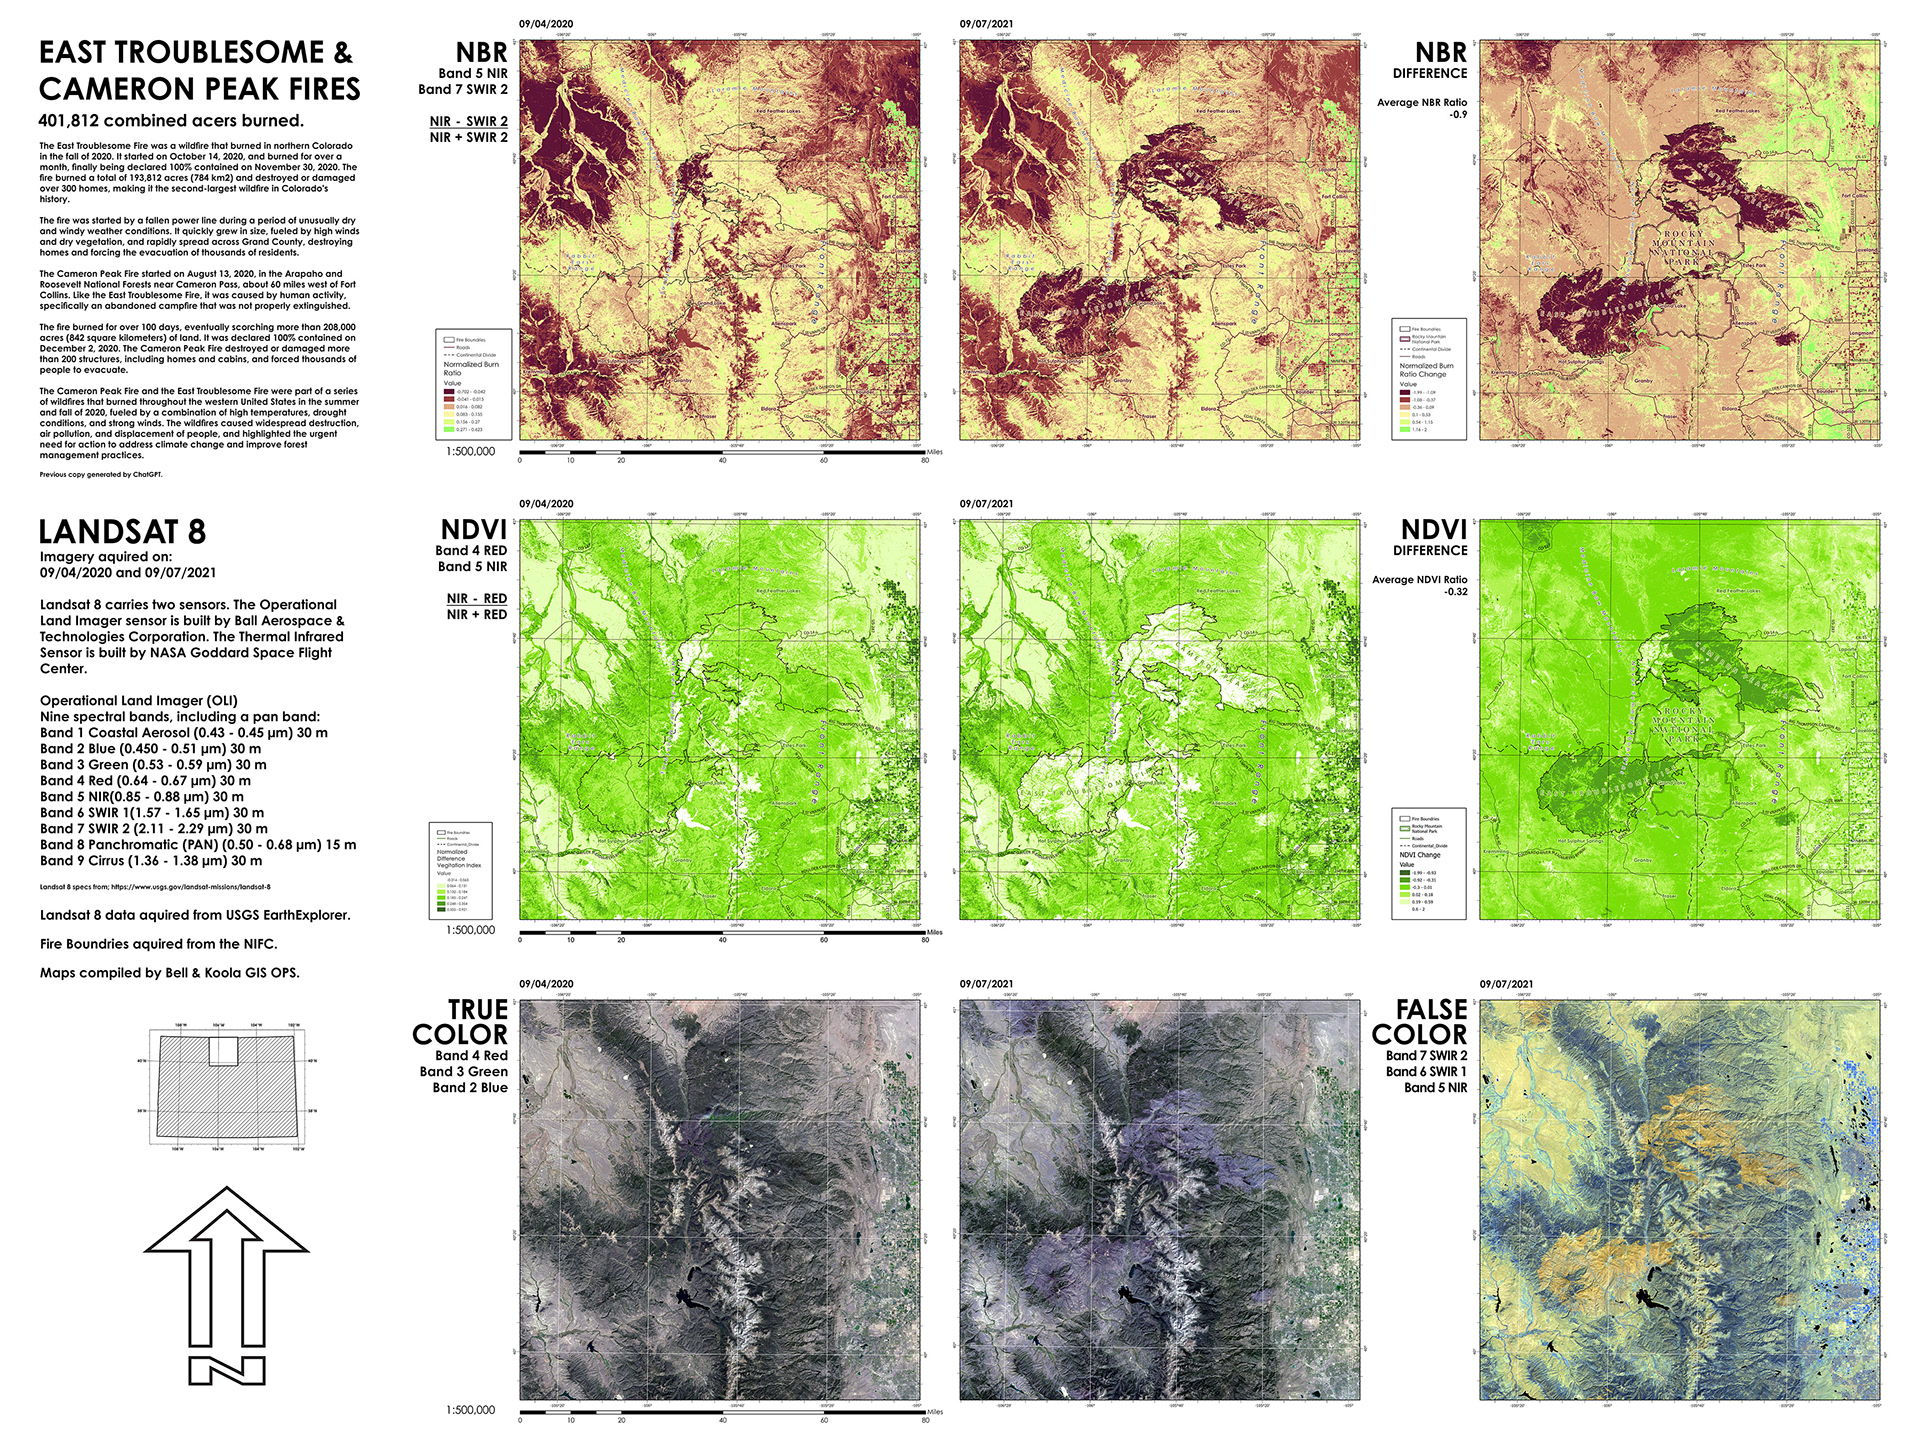
The burn areas are so huge that when deciding on the scale, 1:500,000 it included agriculture areas beyond the Front Range, which I feel is important to include for reference. And seeing that I wanted to show NBR, NDVI and True Color, that meant my map would be huge.
The first version of my ArcPRO build included all 9 maps, and that was choking my poor little Dell laptop, so I had to split the projects into 3 separate ones. In the three separate layouts I added the graticules, scale bars and legends.
Since this is a multi map project with repeated graphic overlays, annotating the Road and Natural Feature labeling with an .AIX output to Illustrator would be too ‘sloppy’. I had to annotate in ArcPRO. Interesting thing about ArcPRo annotation is that the color info resides in the .gbd and not the file or map layer. That meant that I could not do color variants for NBR and NIDV. That is why those labels are in black with white halos.
The last big step was to export out the ArcPRO builds as tiffs and lay it out in Photoshop, where I added titles, descriptions, tags and dates. The copy in the upper left corner was generated by Chat GPT and I got the Landsat-8 specs from, of course, the USGS Landsat-8 website. And finally I added my signature north arrow.
